
You should spend about 20 minutes on this task.
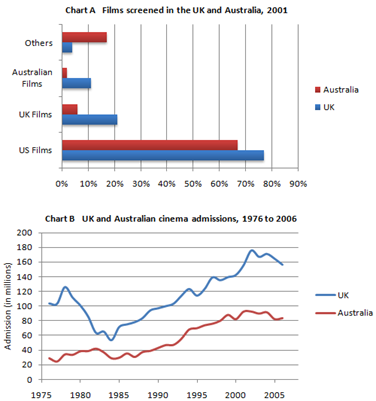
The charts A and B show the share of the UK and Australian cinema market in 2001 and cinema admission in the UK and Australia from 1976 to 2006.
Summarize the information by selecting and reporting the main features, and make comparisons where relevant.
Write at least 150 words.
(The image is attached to the lesson.)
Step 1: Analyze the Question (1 minute)
Task: Summarize the data from charts A and B regarding the cinema market share in the UK and Australia in 2001 and cinema admissions from 1976 to 2006.
Key Features:
- Identify the major trends in cinema market shares between the UK and Australia.
- Compare cinema admissions over the specified time periods in both countries.
Step 2: Identify Main Features (1 minute)
Overall Trends:
- US films dominate the cinema market shares in both countries.
- Cinema admissions in the UK are higher than in Australia.
Important Data Points:
1 Chart A (Cinema Market Shares in 2001):
- US Films: 77% market share in the UK; 67% in Australia.
- UK Films: Just over 20% in the UK; only 5% in Australia.
- Australian Films: 11% in the UK; minimal share in Australia.
- Other Films: Australia holds 17%, while the UK has 4%.
- Chart B (Cinema Admissions from 1976 to 2006):
- UK Admissions: Showed significant fluctuations, peaking at 150 million.
- Australian Admissions: Increased steadily, rising from 30 million to just over 80 million between 1997 and 2006.
Step 3: Write an Introduction (30 seconds)
Summarize the charts: “The charts illustrate the cinema market shares for different films in the UK and Australia in 2001 (Chart A) and cinema admissions in both countries from 1976 to 2006 (Chart B).”
Step 4: Write an Overview (1 minute)
Highlight main trends:
- US films hold a substantial market share in both countries, significantly more in the UK.
- While UK cinema admissions are consistently higher, Australia experienced notable growth in cinema attendance, particularly in the later years.
Step 5: Plan Detailed Paragraphs (1.5 minutes)
Body Paragraph 1: Cinema Market Shares (Chart A)
- Discuss the dominance of US films in both markets, comparing their shares (77% in the UK and 67% in Australia).
- Highlight the smaller market shares for UK films in Australia and the presence of Australian films in the UK market.
Body Paragraph 2: Cinema Admissions (Chart B)
- Describe the trends in cinema admissions in the UK, noting the fluctuations and the peak of 150 million.
- Discuss the growth trend in Australian cinema admissions, particularly the increase from 30 million to over 80 million from 1997 to 2006.
Sample Band 9 Response
The charts illustrate the cinema market shares for different films in the UK and Australia in 2001 (Chart A) and cinema admissions in both countries from 1976 to 2006 (Chart B).
Overall, US films held the largest share of the cinema market in both the UK and Australia, with a significantly higher percentage in the UK. In terms of cinema admissions, the UK consistently had higher attendance compared to Australia, although Australia experienced substantial growth in cinema visits over the years.
Chart A reveals that US films dominated the cinema market in both countries, with a 77% share in the UK and 67% in Australia. UK films had a more significant presence in the UK market, accounting for just over 20%, but only 5% in Australia. Australian films held an 11% share in the UK, while their presence in the Australian market was minimal. Other films had a larger share in Australia at 17%, compared to just 4% in the UK.
Chart B shows cinema admissions trends from 1976 to 2006. In the UK, admissions fluctuated significantly but peaked at 150 million. Australia, in contrast, saw a steady increase in cinema attendance, rising from 30 million in 1997 to just over 80 million by 2006.
205 words