
You should spend about 20 minutes on this task.
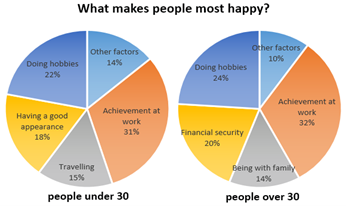
The charts below show the results of a survey about what people of different age groups say makes them most happy.
Summarize the information by selecting and reporting the main features, and make comparisons where relevant.
Write at least 150 words.
(The image is attached to the lesson.)
Step 1: Analyze the Question (1 minute)
Task: Summarize the pie charts depicting survey results on what makes different age groups happy.
Key Features:
- Identify similarities and differences between younger and older people’s responses.
- Highlight the most significant factors contributing to happiness for each age group.
Step 2: Identify Main Features (1 minute)
Overall Trends:
- Similarities: Achievement at work and doing hobbies are the top factors for both age groups.
- Differences: Younger people prioritize appearance and travel, while older people focus on financial security and family.
Important Data Points:
Younger Group:
- Achievement at work: 31%
- Doing hobbies: (2nd largest percentage, not specified)
- Good appearance: 18%
- Travel: 15%
Older Group:
- Achievement at work: 32%
- Doing hobbies: (2nd largest percentage, not specified)
- Financial security: 20%
- Family: 14%
Step 3: Write an Introduction (30 seconds)
Summarize the charts: “The pie charts illustrate survey results on the factors contributing to happiness among different age groups.”
Step 4: Write an Overview (1 minute)
Highlight the main trends:
- Both younger and older age groups agree that achievement at work and hobbies are significant sources of happiness.
- There are notable differences, with younger individuals placing importance on appearance and travel, while older individuals value financial security and family connections.
Step 5: Plan Detailed Paragraphs (1.5 minutes)
Body Paragraph 1: Similarities
- Discuss the common factors: achievement at work (31% for younger, 32% for older) and the importance of hobbies for both groups (2nd largest percentage).
Body Paragraph 2: Differences
Focus on the unique priorities for each age group:
- Younger people: 18% value good appearance, 15% value travel.
- Older people: 20% prioritize financial security, 14% value time spent with family.
Sample Band 9 Response
The pie charts illustrate survey results on the factors contributing to happiness among different age groups.
Overall, both age groups share a strong emphasis on achievement at work and hobbies as significant sources of happiness. However, there are distinct differences, with younger individuals valuing appearance and travel, while older individuals prioritize financial security and family.
For both groups, the most common factor contributing to happiness is achievement at work, with 31% of younger people and 32% of older people highlighting this as their main source of happiness. Hobbies also rank highly for both groups, being the second most popular source of happiness, though the exact percentages are not specified.
In terms of differences, younger people place significant importance on appearance, with 18% citing it as a key factor for their happiness, followed by 15% who value travel. In contrast, older people prioritize financial security, with 20% stating it makes them happiest, and 14% identifying family as their main source of happiness. These factors are not emphasized by the younger group.
170 words