
You should spend about 20 minutes on this task.
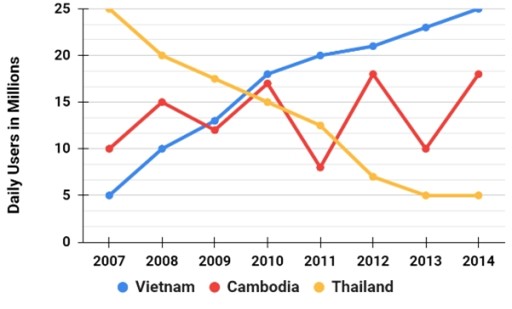
The line graph below shows active daily users on Facebook in three different countries.
Summarize the information by selecting and reporting the main features, and make comparisons where relevant.
Write at least 150 words.
(The image is attached to the lesson.)
Step 1: Analyze the Question (1 minute)
Task: Summarize the line graph showing active Facebook users in Vietnam, Cambodia, and Thailand from 2007 to 2014.
Key Features:
- Identify trends: Increase, decrease, fluctuations.
- Make relevant comparisons between countries.
Step 2: Identify Main Features (1 minute)
Overall Trends:
- Vietnam: Consistent increase.
- Cambodia: Fluctuations (rise and fall).
- Thailand: Initial decline, stabilization after brief rise.
Important Data Points:
- Vietnam: Steady growth (under 5 million to over 20 million).
- Cambodia: Peaks and dips (9 million, 14 million, then 10.5 million).
- Thailand: Sharp drop (22 million to 10.5 million, brief rise, then stabilizes at 13 million).
Step 3: Write an Introduction (30 seconds)
Summarize the graph: “The line graph illustrates the daily number of active Facebook users in Vietnam, Cambodia, and Thailand from 2007 to 2014.”
Step 4: Write an Overview (1 minute)
Provide the main trends:
- Vietnam’s steady growth.
- Cambodia’s fluctuations.
- Thailand’s decline, brief rise, then stabilization.
Step 5: Plan Detailed Paragraphs (1.5 minutes)
Body Paragraph 1: Vietnam’s Growth and Cambodia’s Fluctuations
- Vietnam: Discuss the consistent growth in Vietnam’s daily Facebook users, starting at under 5 million in 2007 and rising steadily to over 20 million by 2014.
- Cambodia: Describe Cambodia’s erratic pattern, beginning at 9 million, peaking at 14 million in 2012, then declining to 9 million in 2013, before a slight recovery to 10.5 million in 2014.
Body Paragraph 2: Thailand’s Decline and Stabilization
- Thailand: Outline Thailand’s sharp drop from 22 million users in 2007 to 10.5 million in 2010. Mention the brief rise back to 22 million in 2011, followed by a stabilization at 13 million from 2012 to 2014.
Sample Band 9 Response:
The line graph illustrates the daily number of active Facebook users in Vietnam, Cambodia, and Thailand from 2007 to 2014.
Overall, Vietnam experienced consistent growth in the number of users, Cambodia saw significant fluctuations, and Thailand showed a marked decline followed by stabilization in later years.
Vietnam’s daily Facebook users steadily increased throughout the period, starting at under 5 million in 2007 and rising consistently to over 20 million by 2014. In contrast, Cambodia displayed a more erratic pattern. The country began with around 9 million users in 2007, saw a slight dip in 2008, then peaked at nearly 14 million by 2012. However, the number of users declined sharply to 9 million in 2013 before a modest recovery to 10.5 million in 2014.
Thailand showed a different trend. The country started with the highest number of users at 22 million in 2007 but experienced a significant drop to 10.5 million by 2010. Although there was a brief recovery to 22 million in 2011, user numbers then stabilized at around 13 million from 2012 to 2014.
176 words